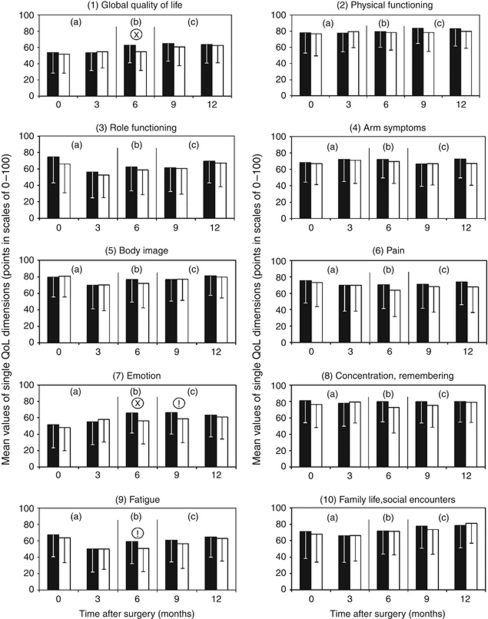
Figure 8.
Mean values±s.d. for the 10 dimensions of the QoL profile: comparison of QoL pathway (▪) with traditional postoperative care (□). Mann–Whitney U-test !=P<0.10, x=P<0.05. Global QoL P=0.018, Emotion P=0.030 and P=0.060, respectively, Fatigue P=0.051. (a) Period of QoL diagnosis; (b) period of QoL therapy; (c) period of follow-up (maintenance omitted if QoL ⩾50 points).

