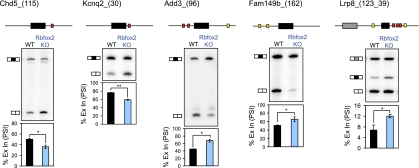
Figure 3.
The Rbfox2−/− brain exhibits splicing changes of exons with adjacent Rbfox-binding sites. Representative denaturing gel electrophoresis of RT–PCR products for Rbfox2-dependent exons. Above each gel is a schematic indicating the alternative exon (horizontal black boxes) and the location of (U)GCAUG binding sites (red and yellow boxes) in the flanking introns (thin horizontal lines). Red boxes indicate (U)GCAUG sites conserved across multiple vertebrate species (Phastcons score >0.5). Shown below the gel is a graph quantifying the mean percentage of alternative exon inclusion (percent spliced in, PSI) in wild-type (WT; black bars) and Rbfox2−/− (blue bars) brains. Error bars represent SEM; n = 3. (*) P < 0.05; (**) P < 0.005; (n.s.) not significant by paired, one-tailed Student's t-test. Exact P-values are shown in Table 1.

