Figure 2.
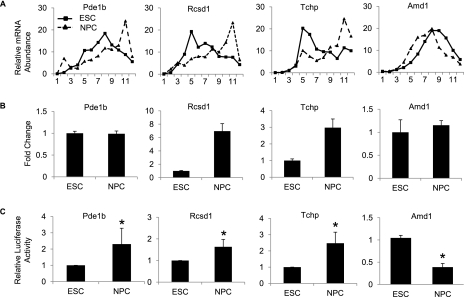
Validation of translationally regulated mRNAs. (A) qRT–PCR analysis showing the percentage of mRNA in each polysomal fraction from ESCs (squares) and NPCs (triangles). All samples are normalized to internal spike-in controls. Fraction 1 represents the top of the gradient and fraction 12 represents the bottom of the gradient. (B) qRT–PCR of candidate mRNAs from total RNA from ESCs and NPCs. (C) Relative luciferase levels in ESCs and NPCs of vectors containing the 3′ UTRs of candidate genes downstream from the luciferase ORF. Values are normalized to control luciferase, and ESC activities are set to 1. Values are means ± SD. (*) P < 0.05.

