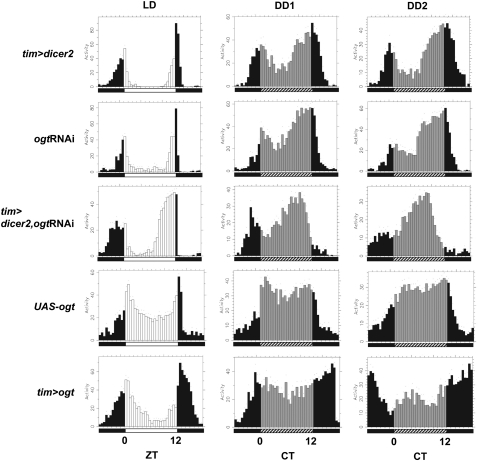
Figure 2.
The daily distribution of activity is altered in ogt knockdown and ogt-overexpressing flies. Each panel represents the average activity (in arbitrary units) of male flies for a given genotype for a consecutive 24-h period during the last day of 1212LD entrainment (LD) followed by the first (DD1) or second (DD2) day of DD. Genotypes are indicated at the left side of each panel. During LD, lights-on is indicated by white vertical bars, and lights-off is indicated by black vertical bars. During DD, subjective day is indicated by gray vertical bars, and subjective dark phase is indicated by black vertical bars. Each vertical bar represents relative activity levels during a 30-min bin. Standard error of the mean is indicated as dots above each bar. (CT) Circadian time. Note that in LD, flies exhibit a bimodal distribution of activity, with a “morning” peak centered around ZT0 and an “evening” peak centered around ZT12. Relative to control flies, the timing of the evening activity component is advanced in ogt knockdown flies (tim>dicer2, ogtRNAi), whereas it is delayed in ogt overexpression flies (tim>ogt).

