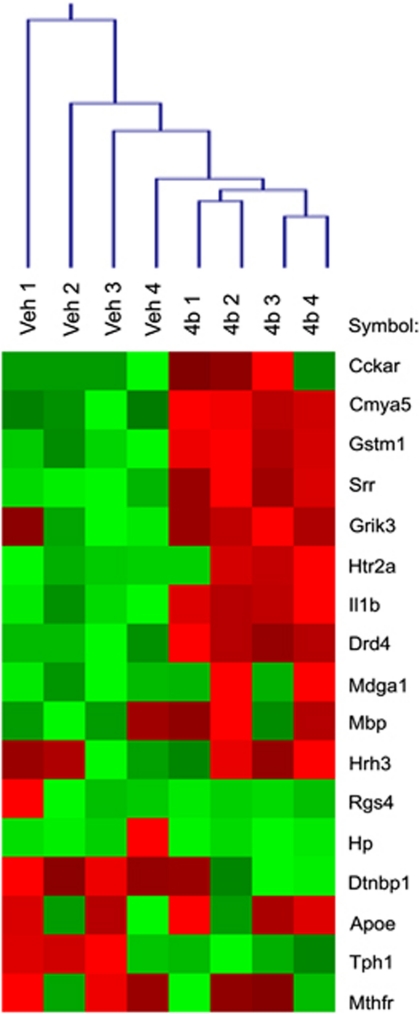
Figure 5.
Heatmap depiction of the 17 schizophrenia candidate genes found to be significantly regulated by HDACi 4b treatment in the mouse brain. Official UniGene symbols are shown for each gene. Each colored pixel represents an individual gene expression value. Relative decreases in gene expression are indicated by green and increases in expression by red. Two-dimensional hierarchical clustering of the samples is shown along the top.

