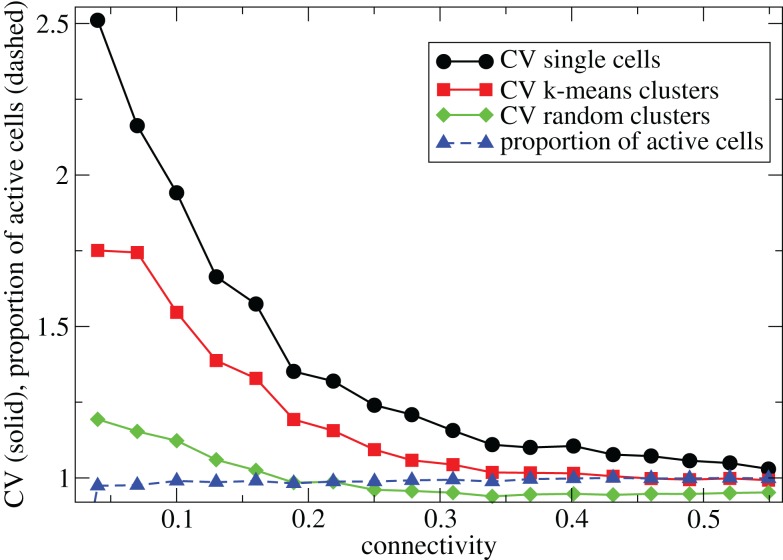
Figure 1.
500 cell network simulations under variation of connectivity for weak input rC = 0.0085, bC = 0.001, α = 5, τg = 50. Each point is calculated from a 50-s time series from a different network simulation. Black solid circles - mean CV over all cells. Red solid squares – mean CV of k-means generated clusters. Green solid diamonds – mean CV of randomly generated clusters. Blue dashed triangles - proportion of cells which fire at least one spike.

