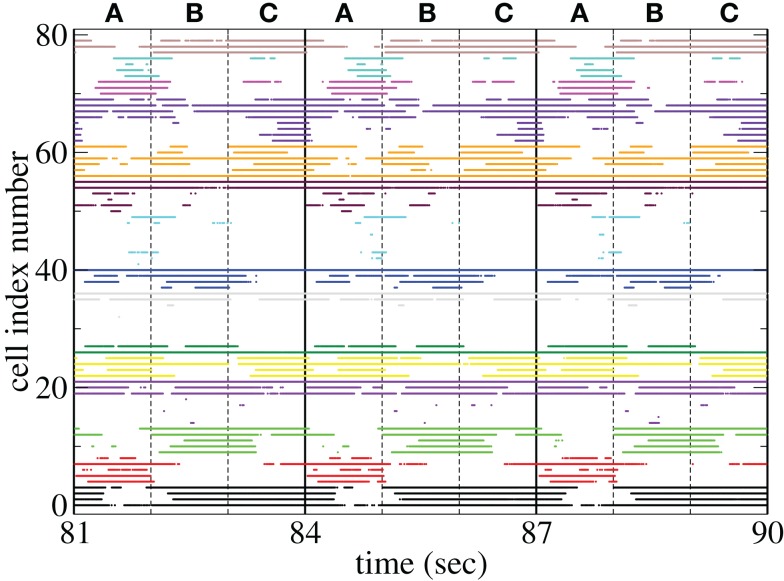
Figure 11.
Raster plot from a segment of a 174-s time series network simulation with 100 cells under input switching protocol 1 s × 3 stimuli, (see text) cells colored according to assigned cluster. Input strength rC = 0.018 spikes/ms, connectivity ρ = 0.1, tail parameter α = 1.5, synaptic strength bC = 0.001.

