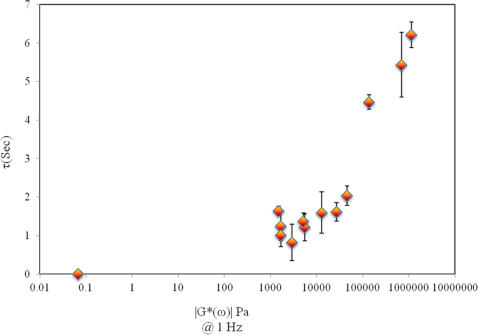
Figure 6. Scatter diagram of τ versus |G*(ω)| at ω = 1 Hz, each data point depicts the mean±standard deviation of at least 6 measurements obtained over a ~7 mm diameter ROI (for solid samples).
A larger standard deviation is observed due to tissue heterogeneity in the compared to phantom results of Fig. 4. A statistically significant and strong correlation is observed for |G*| from 60 m Pa to 600 K Pa (r = 0.88, p<0.0001).

