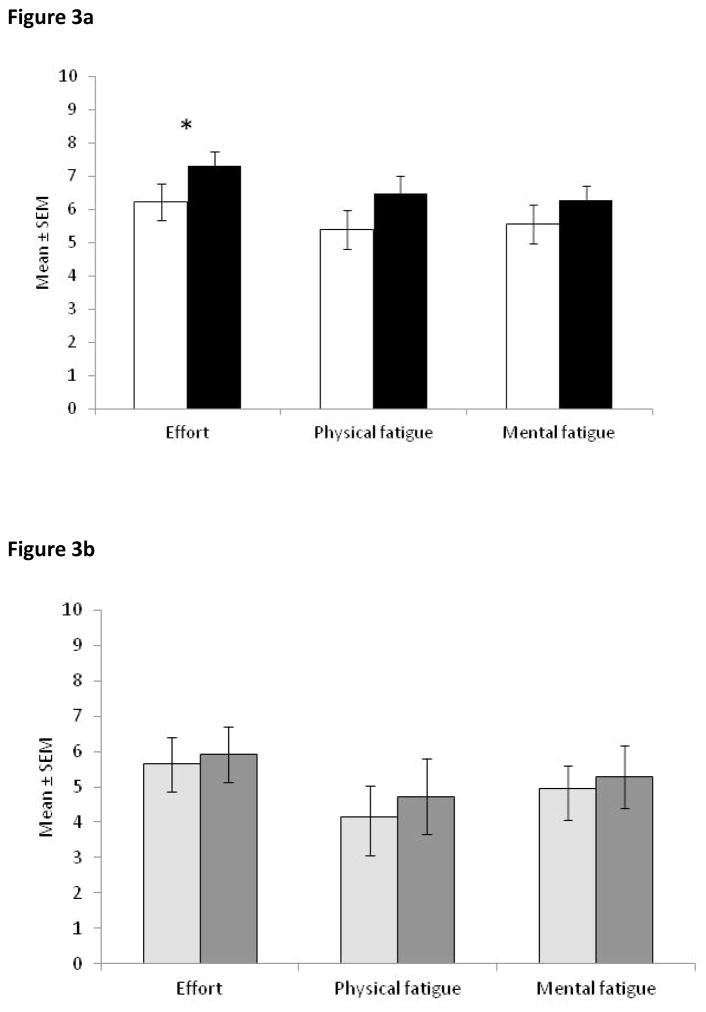
Figure 3.
Effort and Physical and Mental Fatigue ratings for (a) STN-DBS patients ON (white bars) and OFF stimulation (black bars) and (b) control PD patients for the 1st (light grey bars) and 2nd (dark grey bars) completion of the scales. Note that higher scores mean greater effort and fatigue. * p < .05 comparison between ON and OFF STN-DBS for that scale. There were no significant differences between completing any of these scales for the 1st and 2nd time for PD controls. Error bars are standard error of the mean.

