
Figure 2. Migration and accumulation of administered EPCs in PTK treated tumor.
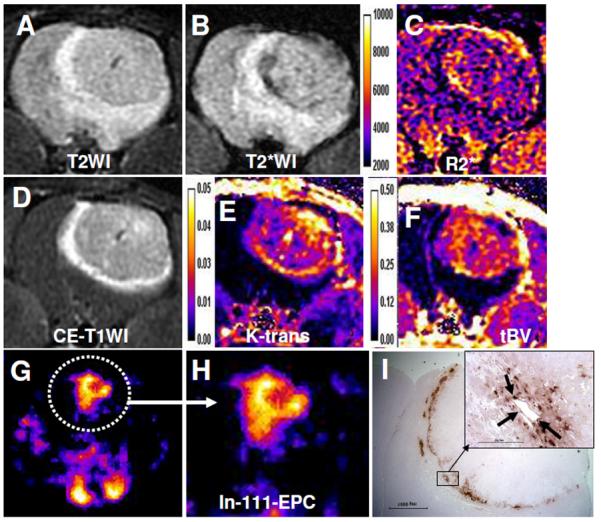
Five million In-111 labeled EPCs followed by 5 million magnetically labeled EPCs were administered in the same rat. SPECT images were obtained on day 0, 1 3 and 7. MRI was obtained by a clinical 3T system on day 7 following last SPECT. (A) T2WI with a TE of 35ms, (B) T2*WI with a TE of 20 and corresponding R2* map (C). (D) Contrast enhanced T1WI and corresponding Ktrans (E) and tumor blood volume (F) maps. Note the low signal intensity areas on T2*WI (B, black arrows) and corresponding R2* map (C, yellow arrows) indicating accumulation of iron positive cells, which is proved by DAB enhanced Prussian blue staining (I). SPECT images of the tumor (G & H) obtained at 24 hours showed increased activity at the site of tumor indicating accumulation of In-111 labeled EPCs. DAB enhanced Prussian blue staining showed accumulation of iron positive cells around the tumor (I). Note a few of the iron positive cells also make the lining of blood vessels (inset, black arrows).