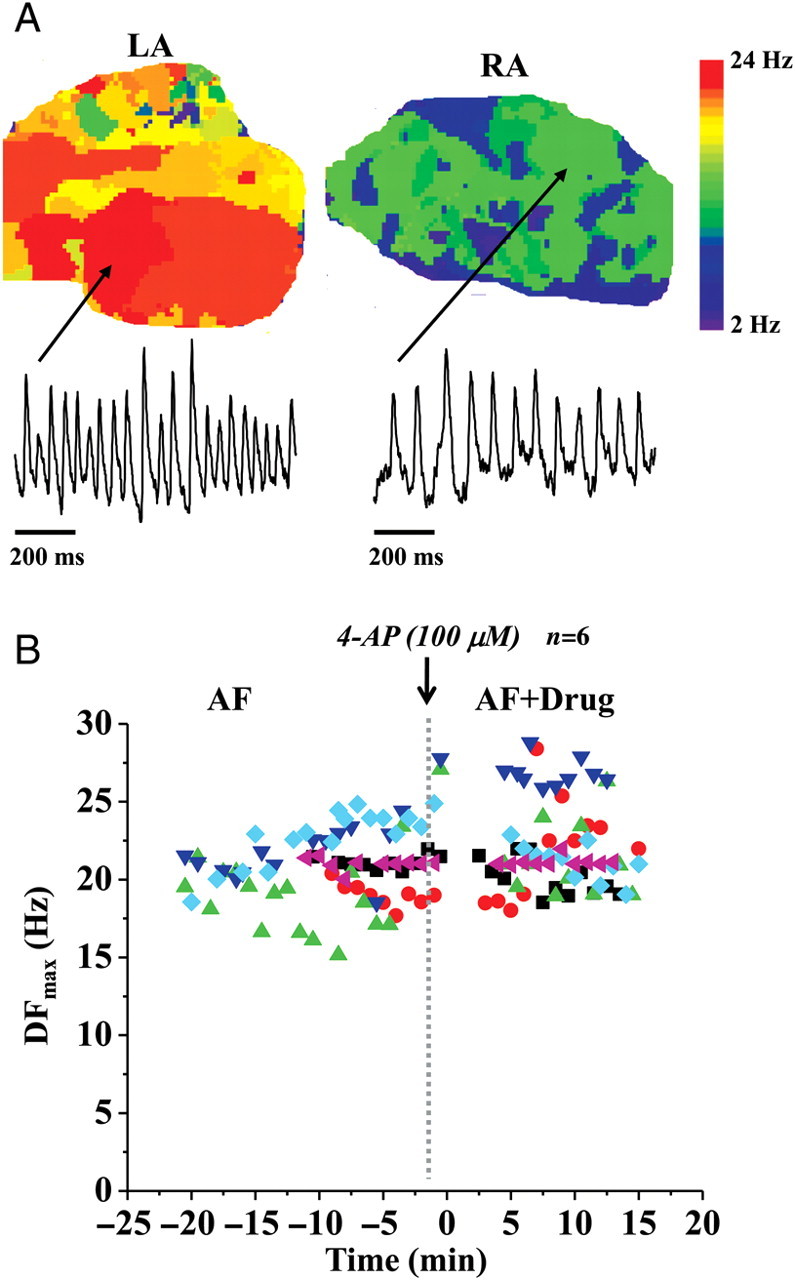
Figure 1.

Experiments in acute atrial fibrillation and in the presence of IKur blockade. (A) Representative dominant frequency maps and single-pixel recordings during acute atrial fibrillation in the left atrium and the right atrium. (B) Plot of the maximum dominant frequency (DFmax) in acute atrial fibrillation experiments in pig hearts vs. time. Time before the introduction of the drug to selectively block IKur (100 μM 4-AP) is assigned negative values.
