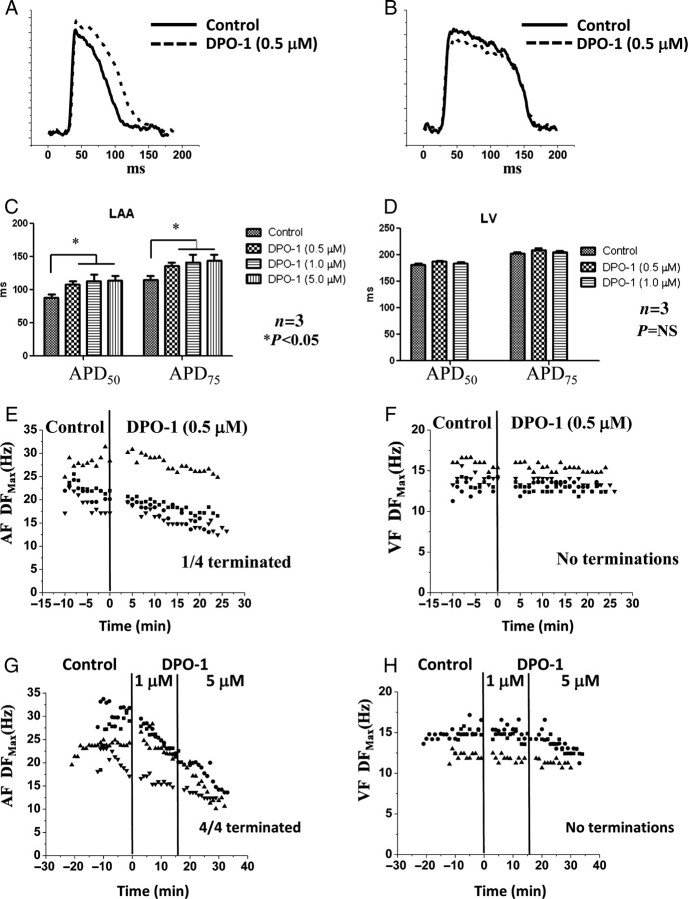
Figure 2.
Experiments in acute atrial fibrillation and ventricular fibrillation and in the presence of IKur blockade (via DPO-1). (A) Representative pig optical atrial action potential in control (solid) and in the presence of 0.5 μM DPO-1 (dashed) at 300 ms pacing. (B) Representative pig optical ventricular action potential in control (solid) and in the presence of 0.5 μM DPO-1 (dashed) at 300 ms pacing. (C) Average atrial action potential durations at 50% (APD50) and 75% (APD75) repolarization in control and in the presence of 0.5, 1.0, and 5.0 μM DPO-1. (D) Average ventricular action potential durations at 50% (APD50) and 75% (APD75) repolarization in control and in the presence of 0.5 and 1.0 μM DPO-1. (E) Plot of DFmax in acute atrial fibrillation experiments in control and in the presence of 0.5 μM DPO-1. (F) Plot of DFmax during ventricular fibrillation in control and in the presence of 0.5 μM DPO-1. (G) Plot of DFmax in acute atrial fibrillation experiments in control and in the presence of 1.0 and 5.0 μM DPO-1. (H) Plot of DFmax during ventricular fibrillation in control and in the presence of 1.0 and 5.0 μM DPO-1.

