Figure 4.
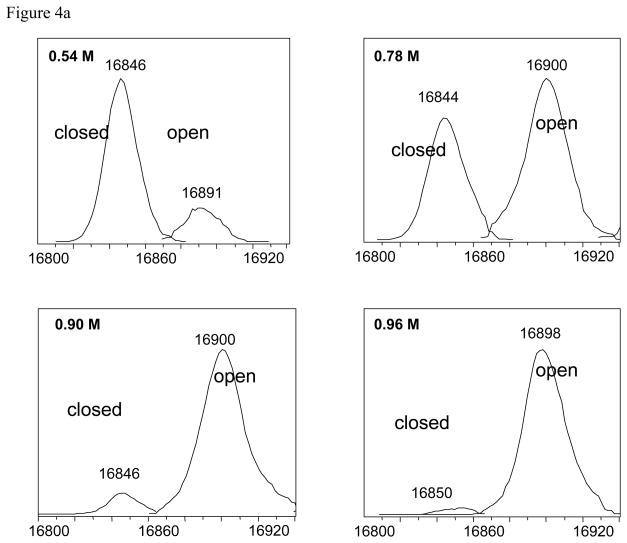
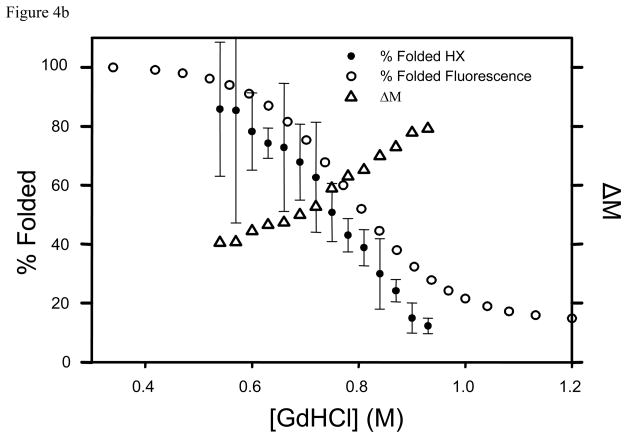
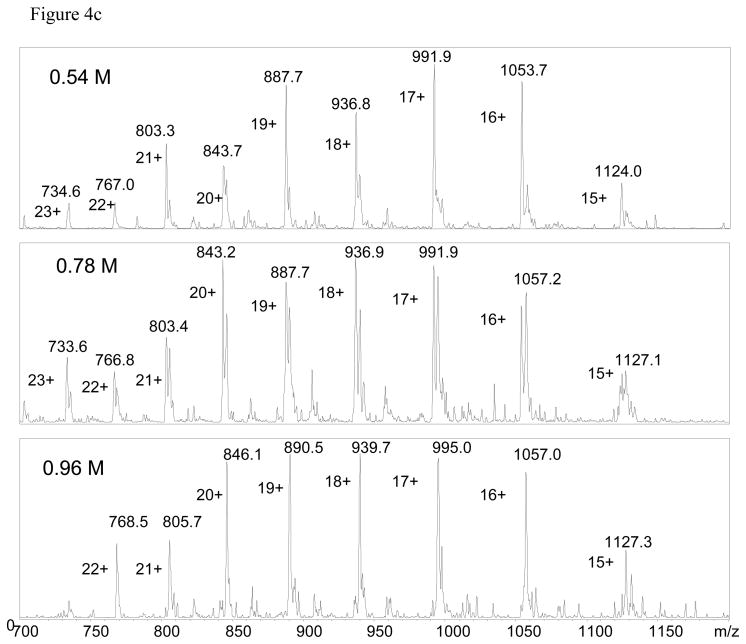
Staphylococcal nuclease wild type by PEPS method. The top panel (a) shows variations in peak intensities corresponding to the deuterated open and closed forms as a function of GdHCl concentration. The middle panel (b) shows Δ M (Δ) {right side y-axis}, the percent of folded protein (●) calculated using Δ M, and the percent of folded protein from fluorescence data (○) [5,6,36]. All are plotted as a function of GdHCl concentration. The bottom panel (c) shows the ESI mass spectra which were deconvoluted to produce the data in panel (a).


