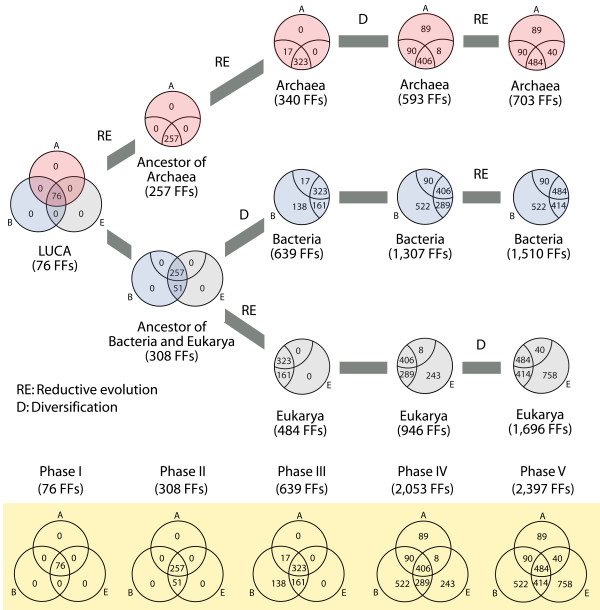
Figure 6.
Model of protein domain and proteome diversification. Venn diagrams show the evolutionary accumulation of FFs in superkingdoms as these distribute in the five phases of the timeline. The tree diagram in the top describes major dichotomies in the organismal world and shows how reductive evolution and diversification has tailored proteome evolution in the three cellular superkingdoms. The model was assembled directly from phylogenomic data.

