
Figure 8.
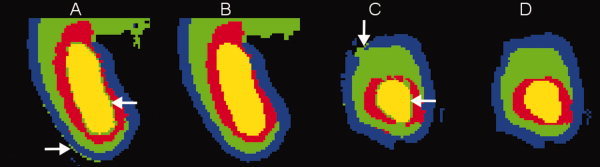
The effect of the neighborhood prior on automatic segmentation of fetal brain images in the area of the occipital lobe: (A and B) axial views of tissue label maps produces in the EM(Pa) and EM(Pa,Pn) modes, respectively, (C and D) coronal views of the same label maps. Label colors are: blue = gray matter, green = white matter, red = germinal matrix, yellow = ventricles. Arrows indicate examples of mislabeled partial volume voxels in the EM(Pa) mode. [Color figure can be viewed in the online issue, which is available at wileyonlinelibrary.com.]