Figure 7.
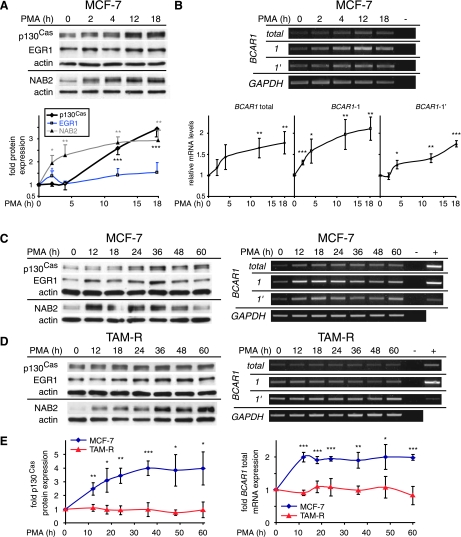
p130Cas mRNA and protein expression are inducible in response to phorbol esters. (A-D) MCF-7 and TAM-R cells, as indicated, were serum starved for 16 hours followed by stimulation with PMA for indicated times up to 60 hours or left untreated (0 h). (A and B, upper panel, and C and D) Results are presented from one experiment of three performed with similar results. (A) Upper panel: WCEs (20 µg) were analyzed for p130Cas, EGR1, and NAB2 protein expression by WB. Lower panel: Densitometric analysis of protein expression. (B) Upper panel: expression of total BCAR1 mRNA and of BCAR1-1, BCAR1-1′, and GAPDH (control) mRNAs was determined by RT-PCR as described previously. - DNA indicates the negative control for PCR. Lower panel: Densitometric analysis of total BCAR1 mRNA, BCAR1-1, and BCAR1-1′ expression. (C and D) Left panels: WCEs (20 µg) were analyzed for p130Cas, EGR1, and NAB2 protein expression by WB. Right panels: Expression of total BCAR1 mRNA and of BCAR1-1, BCAR1-1′, and GAPDH (control) mRNAs was determined by RT-PCR as described previously. + control indicates positive control for PCR; - DNA, negative control for PCR. (E) Densitometric analysis of p130Cas protein (left panel) and total BCAR1 mRNA (right panel) expression in MCF-7 and TAM-R cells. (A and B, lower panel, and E) Average expression levels in relation to untreated cells (set to 1) and SD from three experiments performed were determined. Statistically significant changes compared with untreated cells are indicated: *P < .05, **P < .01, and ***P < .001. P values were calculated using t test.

