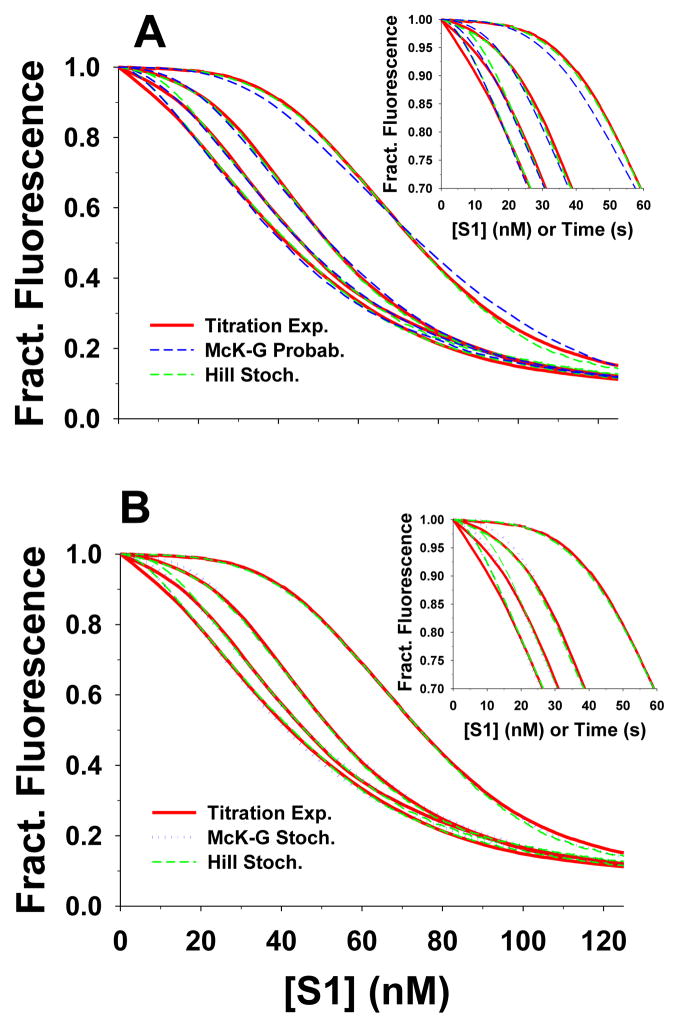
Figure 4.
The best fits of titrations of 50 nM pyr-actin-phalloidin with S1 in the presence of TmTn (0.1 μM) using the Hill and McKillop-Geeves models. The titration time courses of four calcium concentrations (pCa 4.6, 5.4, 6.8 and 8.9) are shown as red lines; in all experiments actin concentration was 50 nM and rate S1 injection rate was 1nM/s. The predictions of the Hill model are denoted as green dashed line, whereas the predictions of McK-G (probabilistic and stochastic) model are denoted as blue dotted lines. The backward rate constants of McK-G model are the same as denoted in Fig. 2. A) Predictions of the Hill model and McK-G probabilistic model and B) predictions of the Hill and McK-G stochastic model.

