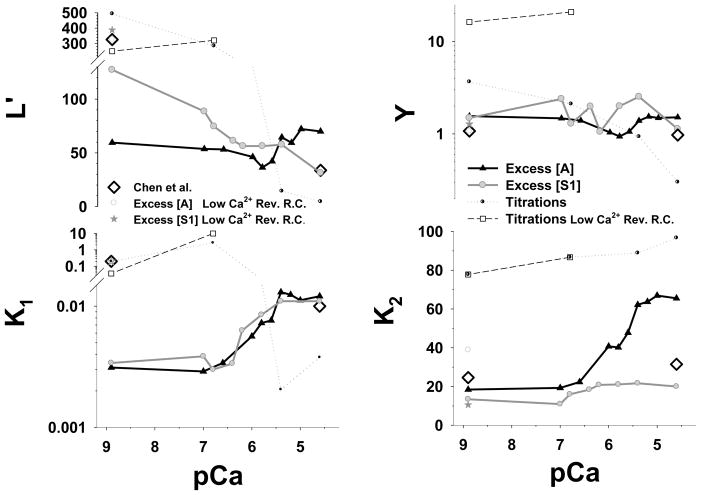
Figure 5.
Estimated Hill model parameters L′, Y, K1 and K2 from the best fits of stopped flow and the titration data are plotted vs. pCa. The parameters L′ and K1 are plotted on a log scale whereas Y and K2 are plotted on a linear scale. The black line with filled triangle up symbols is best fit of the excess actin data set, the grey line with grey filled circle symbols is the best fit the excess S1 data, and the black doted line with semi-filled circle symbols is the best fit of the titrations. The reverse constants β0 =300 s−1, k−1 =500 s−1, k−2 =0.09 s−1 and Y2 = 0.208 are kept the same in all simulations. For comparison we also plotted parameters estimated by Chen et al. from different data sets (open black diamonds).1 Chen used in his fitting scheme different values for the reverse constants k−1 and Y2 at low Ca2+ concentration, denoted as “Low Ca2+ Rev. R.C.”, having values of 3 s−1 and 0.0703 respectively. The estimated parameters for these reverse constants are denoted grey open circles for the excess actin, as dark grey stars for the excess S1, and as black dashed line with open square symbols for titrations.

