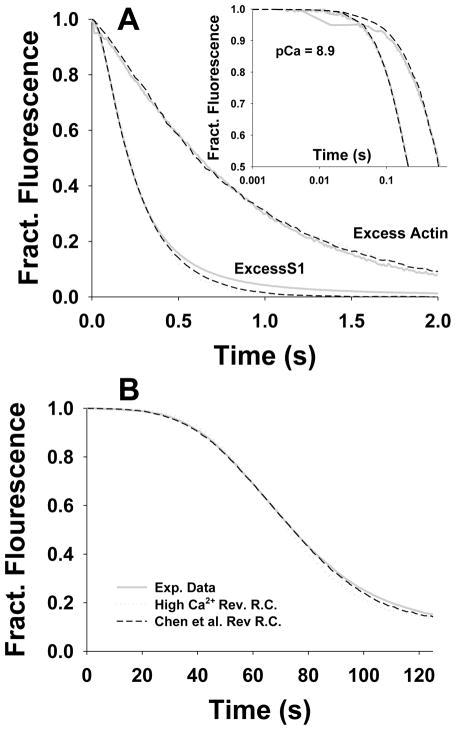
Figure 6.
The comparative best fits of stopped flow and titration data at low [Ca2+] (grey solid lines) by the Hill model for the two sets of reverse constants: (i) High [Ca2+] reverse rate constants k− 1 =500 s−1, Y2= 0.208 denoted as dark gray dotted lines and (ii) Chen’s reverse rate constants at low [Ca2+] k−1 = 3 s−1 and Y2 =0.0703 denoted as black dashed lines. A) For the excess F-actin (2.5 μM pyrene actin) vs 0.25 μM S1 after mixing and for the excess S1 (5 μM) vs. 0.5 μM pyrene actin both at pCa=8.9. B) For titrations at pCa=8.9.

