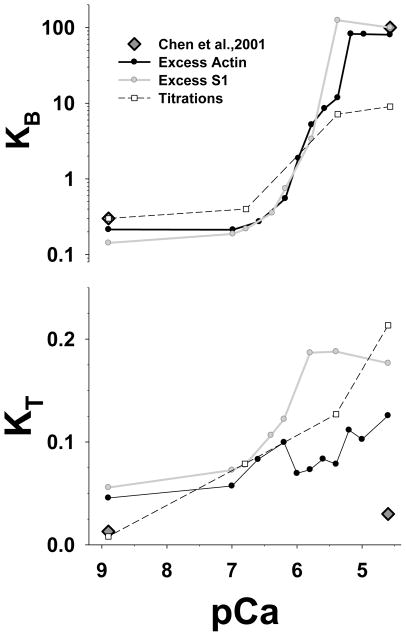
Figure 7.
Estimated McKillop-Geeves (probabilistic) model parameters KB and KT from the best fits to the stopped flow and the titration data are plotted vs. pCa. The unit size in all simulations is N=7. The parameter KB is plotted on a log scale whereas KT is plotted on a linear scale. The black line is best fit of the excess actin data set, the grey line is the best fit to the excess S1 transient, and the black dashed line with open square symbols is the best fit of the titration data. Dark grey diamonds are the data from Chen et al.1

