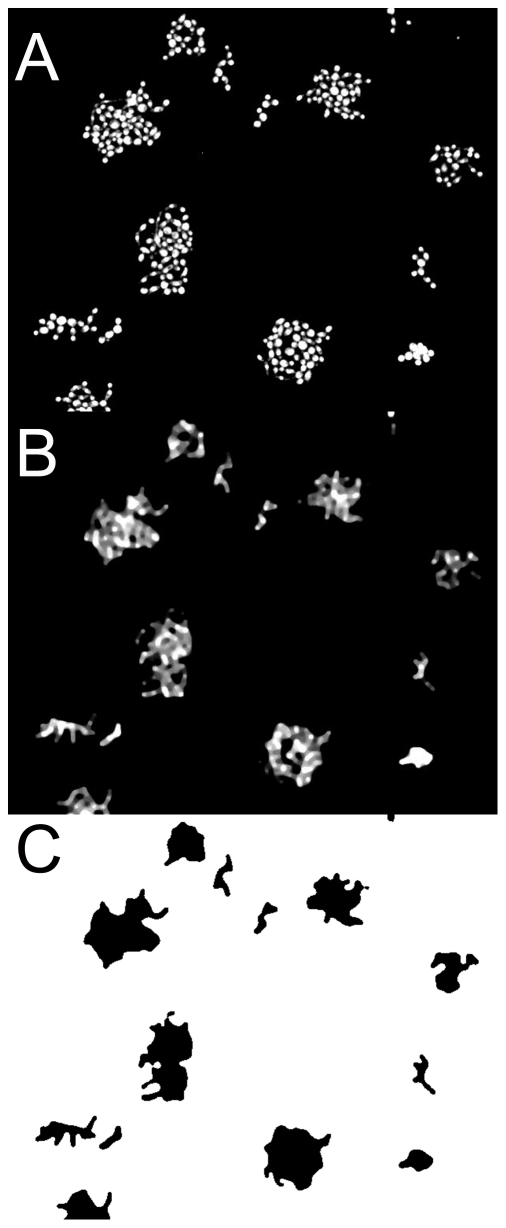
Figure 1. Illustration of digitization process.
A, Raw image (100 µm across with10% area of a full picture shown) of microcolonies of C. krusei 870 containing up to 24 cells. B, Same image, now digitally processed with Median filter to merge individual cells within the same microcolony. C, Conversion of image from panel B to binary image to allow calculation of microcolony area.

