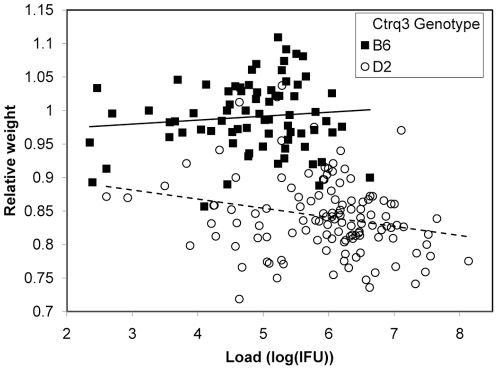
Figure 7. Genetic resistance and tolerance to Chlamydia infection in mice.
Plot of weight change as a function of IFU for 197 BXD mice infected with C. psittaci. Mice with the susceptible D genotype at the Ctrq3 (open symbols) lose weight as pathogen load increases, while mice with the resistant B genotype at the Ctrq3 marker (filled circles) do not. The slopes of the linear regression lines for the B (solid line) and D (dashed line) data are significantly different (p = 0.02).

