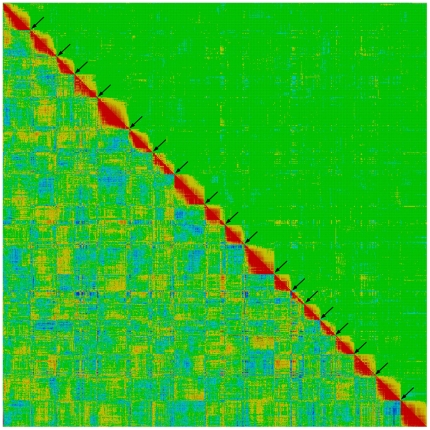
Figure 3. Graphical representation of the high quality linkage map of M. sinensis.
The image is produced with CheckMatrix (http://www.atgc.org/XLinkage/) to validate and verify the quality of the composite map using BIT score (low-left diagonal) and REC score (top-right diagonal). Red color represents tight linkage; yellow represents weak linkage; green to blue represents no linkage. The red along the diagonal, but lack of red off the diagonal, indicate that marker assignments and orders in the 19 linkage groups are supported by both JoinMap and CheckMatrix.

