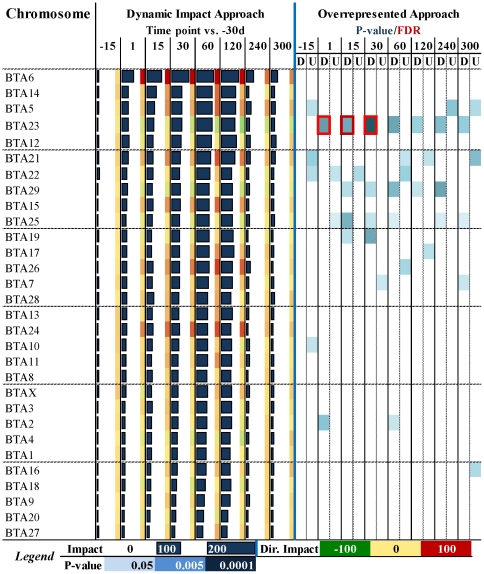
Figure 2. Dynamic impact approach (DIA) and overrepresented approach (ORA) results of DEG during lactation vs. −30d on bovine chromosomes.
The chromosomes are sorted in descending order by the overall impact as calculated by the DIA during lactation (from 15 to 120 vs. –30d). For the DIA the horizontal bars denote the impact and the colored squares on the right denote the direction of the impact (red = increase; green = decrease) (see Figure 1 for detailed explanation). For the ORA reported are the results from analysis with DAVID of up-regulated and down-regulated DEG per each comparison. Highlighted in blue are the chromosome significantly enriched with P≤0.05 for the comparison (darker lower the P-value). Red squares denote a false discovery rate (FDR)≤0.05. The overall data indicate that BTA6 was the most impacted and activated chromosomes during lactation, followed by BTA14 and BTA5. The BTA23 was highly impacted but it appeared that transcription of the genes contained in this autosome was generally inhibited during lactation. This chromosome was also the only one showing a significant enrichment with a FDR≤0.05 in few comparisons.

