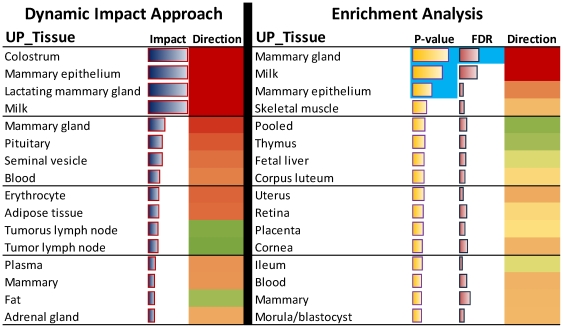
Figure 3. Direct comparison between the Uniprot Tissue analysis results from the Dynamic Impact Approach (DIA) and enrichment or overrepresented approach (ORA) during lactation (from 15 to 120 vs. −30d).
Reported are the 16 top Uniprot Tissue term from each analysis. For the DIA shown are the tissue name, the average impact (horizontal blue bars) and direction of the impact (red = induced; green = inhibited) during lactation. For the ORA shown are the name of the tissue, the average P-value (i.e., average –log P-value; orange horizontal bars), the average Benjamini-Hochberg corrected P-value (i.e., average –log Benjamini-Hochberg corrected P-value or FDR; horizontal purple bars), and the estimated direction of the enrichment (i.e., [mean –log P-value enrichment of up-regulated DEG] – [mean –log P-value of down-regulated DEG]). In light blue shade are highlighted the tissues with a mean enrichment P-value or FDR≤0.05 (or –log P-value≥1.33).

