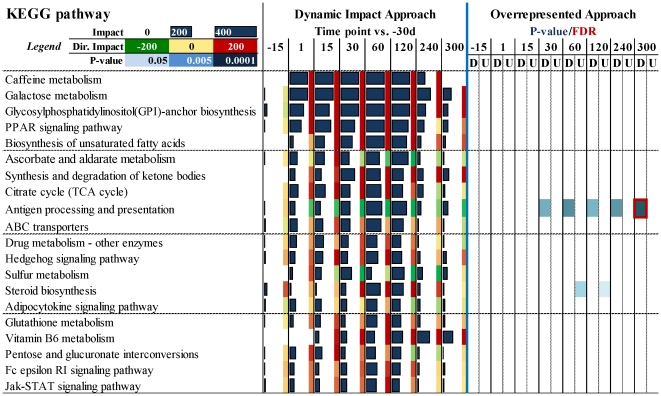
Figure 4. Twenty most impacted KEGG pathways during lactation (excluding the pathways in Human disease category, see file S5, ‘KEGG pathways’ sheet for details) compared to dry period (from 15 to 120 vs. −30d).
For the Dynamic Impact Approach (DIA) the horizontal bars denote the impact and the colored squares on the right denote the direction of the impact (red = increase; green = decrease) (see Figure 1 for detailed explanation). For the overrepresented approach (ORA) reported are the results from analysis with DAVID of up-regulated and down-regulated DEG per each comparison. Highlighted in blue are the KEGG pathways significantly enriched with P≤0.05 for the comparison (darker lower the P-value). Red squares denote a false discovery rate (FDR)≤0.05.

