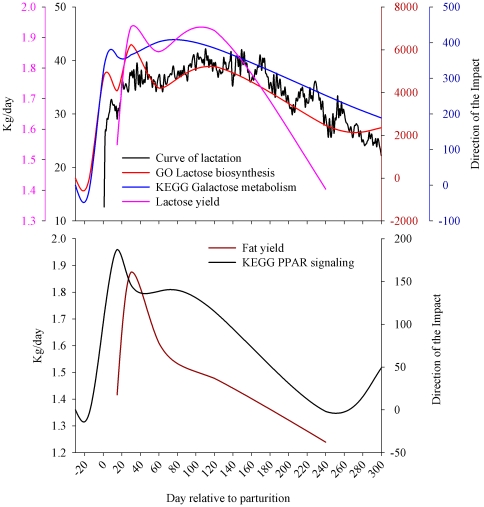
Figure 5. Upper panel: pattern of curve of lactation, milk lactose yield, and the direction of impact as calculated by the Dynamic Impact Approach of KEGG ‘Galactose metabolism’ pathway and GO Biological process ‘Lactose biosynthetic process’.
Lower panel: pattern of milk fat yield and direction of the impact of KEGG ‘PPAR signaling’ pathway. The correlation was positive between the curve of lactation and lactose yield with ‘Galactose metabolism’ (r = 0.87, P = 0.02 and r = 0.81, P = 0.09, respectively) and ‘Lactose biosynthetic process’ (r = 0.82, P = 0.05 and r = 0.88, P = 0.05, respectively). The correlation was positive (r = 0.56) but not significant (P = 0.32) between milk fat yield and ‘PPAR signaling’.

