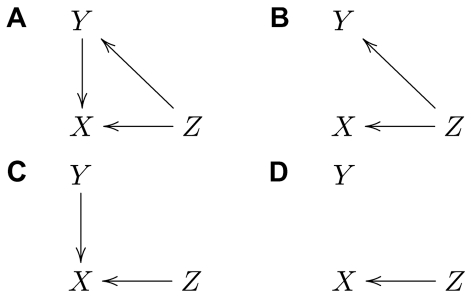
Figure 1. Causal graphs illustrating the effect of interventions.
A: Graph showing a case where the statistical dependence between  and
and  is (partly) due to a causal interaction from
  to
to  . B: Graph showing a case where the statistical dependence between
  and
and  is induced solely by the confounding variable
  . C: Graph corresponding to the intervention
  in the causal graph shown in A. D: Graph corresponding to the intervention
  in the causal graph shown in B.

