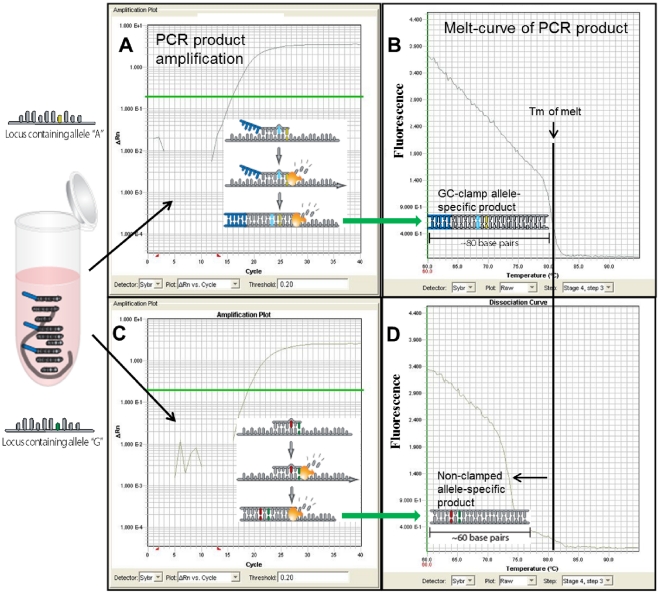
Figure 3. Real-time PCR amplification and dissociation (melt) curve plots.
B. anthracis Melt-MAMA SYBR® Green assay targeting the A.Br.004 genetic clade. (A & C) The amplification of two alleles are illustrated for haploid template (Bacillus anthracis) possessing an ‘A’ polymorphic SNP-state or ‘G’ state. Each amplification plot represents a single PCR reaction containing a reverse “common” primer and two allele-specific MAMA primers. The AS-MAMA primers anneal to the same template target and then compete for extension across the SNP position. The polymerase-mediated extension rate of the 3′match AS-MAMA primer (perfect primer-template complex) exceeds that of the 3′mismatched MAMA primer (mismatched primer-template complex), thus the perfect match primer-template complex outcompetes the mismatched primer-template complex and dominates the PCR amplification. (B & D) Plots of the temperature-dissociation (melt) curve of the final PCR products for the two allele templates are shown next to their respective amplification plots (green arrows). Allele-specific PCR products are easily differentiated through temperature-dissociation (melt) curve analysis, which is conferred by the GC-clamp engineered on one of the AS-MAMA primer.

