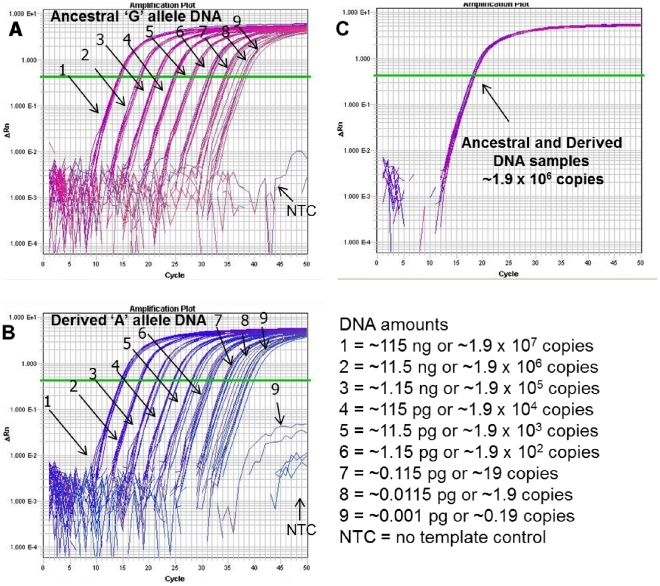
Figure 6. TaqMan assay performance at a broad range of DNA amounts.
A B. anthracis TaqMan assay was used to screen the polymorphic ‘G’ or ‘A’ DNA templates (ancestral and derived, respectively) used in the B. anthracis Melt-MAMAs. (A & B) The respective amplification plots of genomic DNA of ‘G’ allele and ‘A’ SNP allele templates show the amplification curves of templates titrated in ten-fold serial dilutions and in replicates of eight. The number assigned to each amplification curve (1–9) denotes the DNA amount for the starting template. (C) Both genomic template types were of equal amounts. The consistency of amplification dropped with lower amounts of initial template, but the dilution levels containing less than a single copy (B. anthracis single copy ∼6 fg) was still detectable in some reactions. Detection of low-level DNA template by TaqMan assays is subject to stochastic sampling effects, which is predictable using a Poisson distribution [4].

