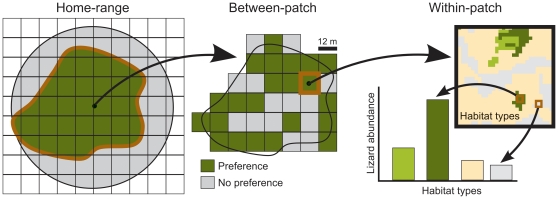
Figure 1. Conceptual diagram showing the three hierarchical scales of habitat preference by lizards.
Home-range preferences, derived from the characteristics of the grid-cells included in the predicted home-range (dark green) and those in the area accessible to lizards (circle enclosing light-grey and dark-green areas), are determined broad-scale habitat features (c. 2.5–10*103 m2). Within home-range preferences, defined as the presence (dark green) vs. absence (light grey) of telemetry locations in the grid-cells included within each home-range, reflect the preferential use of certain habitats within each home-range. Microhabitat preferences, based on surveys of lizard abundance at each habitat type, reflect the uneven use of space within each grid-cell. Grid-cells represent the spatial unit (‘grain’) of observation within our study area.

