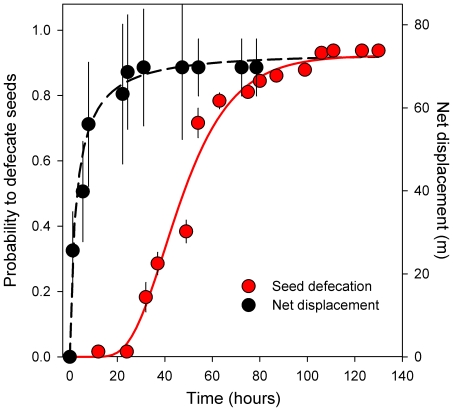
Figure 2. Cumulative frequency of defecation of Ephedra seeds ingested by lizards over time (i.e., proportion of ingested seeds defecated during such time interval; left axis), and net displacement (i.e., maximum net distance from the last relocation to the release location) of radio-tagged lizards over time (right axis).
Lines represent accumulative log-normal fits. Symbols represent daily averages (±SE) each two hours of both variables (see material & methods); note, however, that fits were based on all measured values (not shown for clarity).

