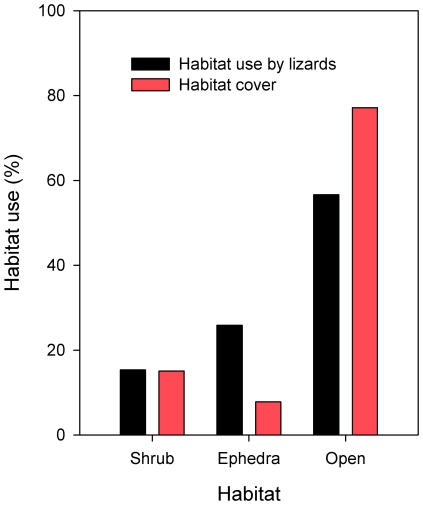
Figure 3. Habitat preference by lizards and habitat cover in the survey area at Dragonera Islet.
Habitat preference by lizards (bars in black) was based on the proportion of visual censuses (n = 506 lizards) whereas habitat cover (bars in red) was calculated from a habitat map which only covers the area of visual censuses.

