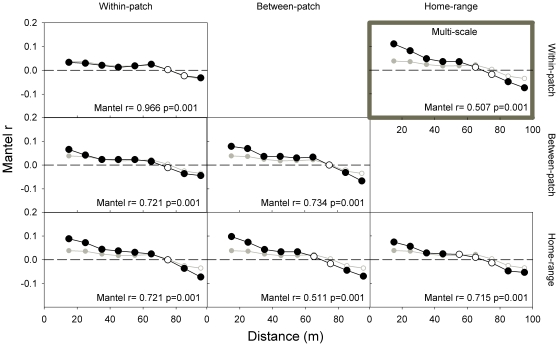
Figure 4. Mantel correlograms of simulated seed rain (seed dispersal probability per grid-cell) across the study-area lattice, using different habitat-dependent scenarios: one ‘random’ scenario, three ‘single-scale’ scenarios (home-range, within home-range and microhabitat preferences; diagonal panels) and their two-scales (‘home-range+within home-range’, etc.; lower-left panels) and three-scales (upper-right panel) combinations.
At each distance, filled symbols indicate significant autocorrelations (Mantel correlation at a given distance matrix after sequential Bonferroni corrections), empty symbols non-significant ones. The ‘random’ scenario is depicted in grey and followed the same conventions as habitat-preference scenarios. At each panel, we also show the results of a partial-Mantel test comparing the similarity of the corresponding habitat-dependent scenario with the ‘random’ one (i.e., higher Mantel-r values indicate higher correlation between both scenarios, p<0.05 a significant departure from the null hypothesis of non-correlation). See Text S3 for further details.

