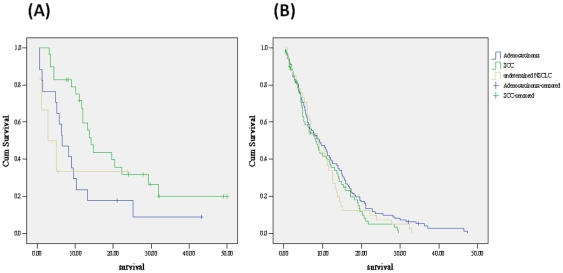
Figure 2. Kaplan-Meier survival curve of (A) NSCLC with active TB grouped by histology (log rank test, p<0.05).
(B) NSCLC without TB grouped by histology (log rank test, p = 0.27). Green line: SCC, Blue line: adenocarcinoma, Yellow line: undetermined NSCLC. SCC: squamous cell carcinoma NSCLC: non-small cell lung cancer

