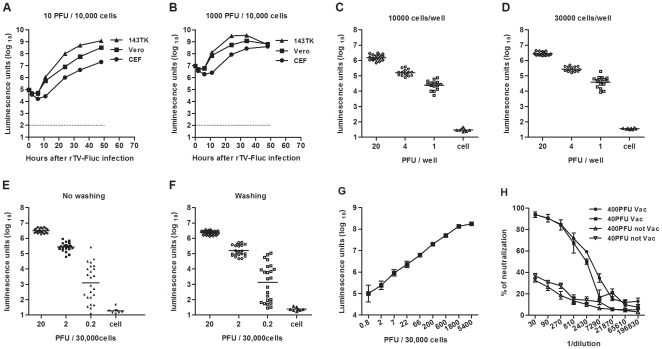
Figure 1. The optimization of the rTV-Fluc neutralization assay.
(A-B) Several cell lines were compared for use in the luciferase assay. The x-axis indicates hours after rTV-Fluc infection, added to 10 PFU/30,000 cells (A) and 103 PFU/30,000 cells (B) in a 96-well plate. The dotted line represents the background level of three cell lines. (C–D) The determination of Vero cell density. The x-axis indicates rTV-Fluc input, added to 104 cells/well (C) and 3×10⁴ cells/well (D) in a 96-well plate. The dot shows the luciferase transgene expression after 24 h incubation. (E–F) The influence of washing with PBS before the addition of luciferin substrate. The x-axis indicates rTV-Fluc input, and the dot represents the luciferase transgene expression after 24 h incubation with no washing (E) and washing (F). (G) Dose-response between rTV-Fluc input and luciferase transgene expression. The x-axis indicates virus concentration, ranging from 0.8–5400 PFU/well, added to 3×10⁴ cells/well in a 96-well plate. Each data point represents the average of eight experiments. (H) Two different concentrations of rTV-Fluc (•,▴, 400 PFU/well; ▪,▾, 40 PFU/well) were used with various concentrations of rabbit serum for neutralizing activity. The same experiment was carried out with rabbit sera collected before (▴,▾) and two weeks after (•,▪) vaccination with VTT. Each data point represents the average of three experiments.

