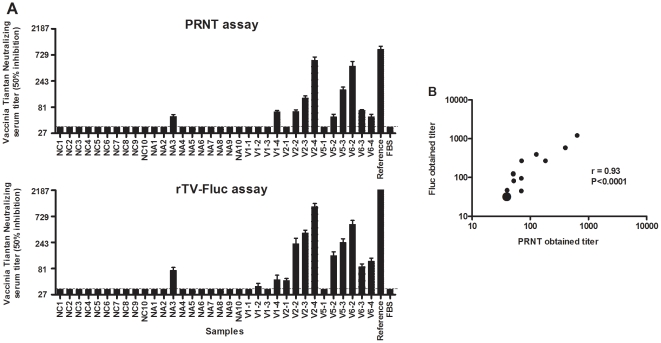
Figure 3. Comparison of two different neutralization assays for the presence of NAbs against VTT in human sera.
Serum titers were determined by the dilution at which 50% of plaque viability or luciferase expression was observed. (A) The y-axis indicates the serum dilution at which 50% infection inhibition was observed, relative to the maximum control value. Dotted lines indicate the lower limits of detection as defined by the maximum concentration of serum. NC1 to NA10, human samples; V1-1 to V6-4, mouse samples. (B) Correlation between neutralization titers obtained in luciferase (y-axis) and PRNT (x-axis). Notably, the overstriking point in B represented the 23∶sera with negative titers. Each data point and column represented the average of three experiments.

