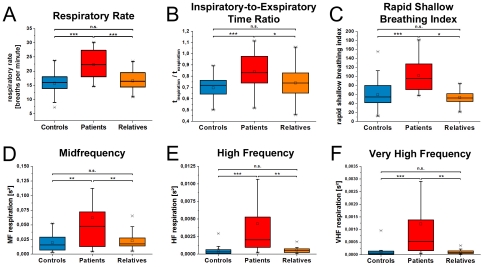
Figure 1. Parameters of respiratory analysis of controls, patients and relatives are presented.
The pattern of significantly altered values of patients in comparison to controls is represented in A–F. The increased breathing rate of patients is presented in A. As shown in B, the inspiratory-to-expiratory time ratio is increased in patients indicating a reduction of the exhalation time. Patients breathe shallowly as indicated in C. Most pronounced are increased frequency bands of respiration as indicated in D–F. Boxes indicate data between the 25th and 75th percentile with the horizontal bar reflecting the median (□ = mean; - = 1st and 99th percentile; x = minimum and maximum of data). Significant differences of Bonferoni corrected pair-wise comparisons are indicated: * p<.05; ** p<.01; *** p<.001.

