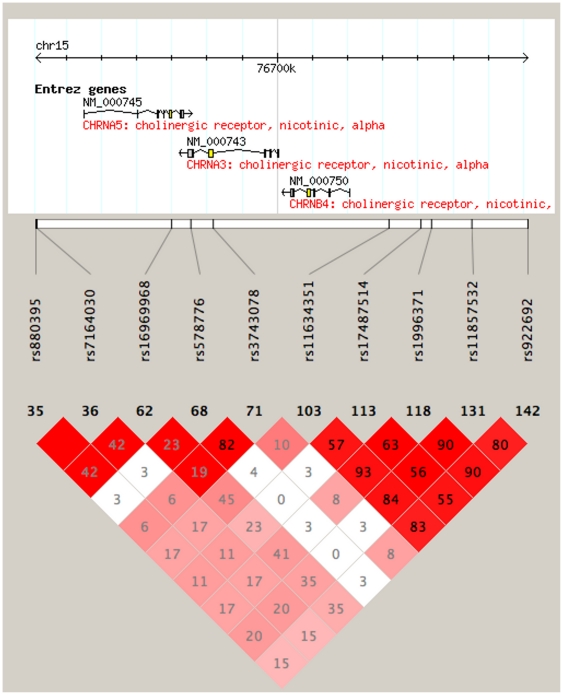
Figure 2. Linkage disequilibrium between genotyped SNPs.
Number in each square represents the a pairwise LD relationship (r2) between the two SNP's in Caucasians using HapMap data and varying red color represent the linkage disequilibrium values for that pair as measured by D′ (bright red shows high D′).

