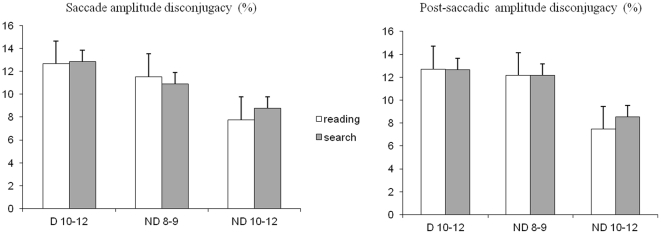
Figure 5. Disconjugacy during and after the saccades.
Mean values of disconjugacy (measured as the percentage of ratio of the disconjugacy on the saccade amplitude) during (A) and after (B) the saccades during reading and during visual search for the three groups of children tested. Vertical lines indicate the standard error.

