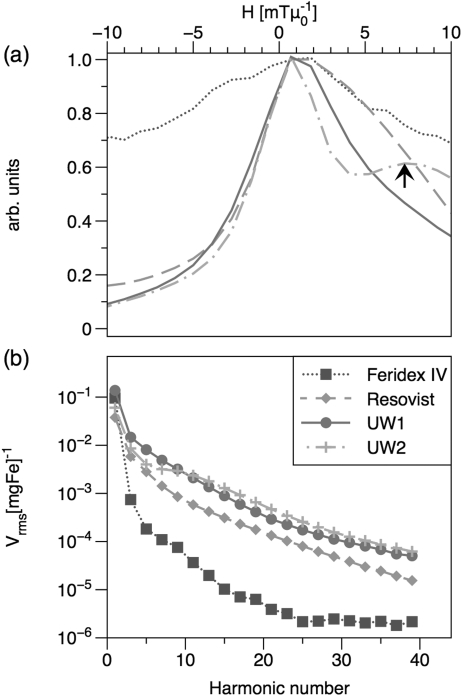
Figure 2.
(Color online) MPI magnetometer measurements taken with an excitation field of 29 mTμ0−1 (peak-peak) at 25 kHz. (a) PSF normalized to 1 for FWHM comparison. The arrow indicates the shoulder in sample UW2’s PSF that is due to relaxation effects; (b) harmonic spectrum normalized by iron concentration.

