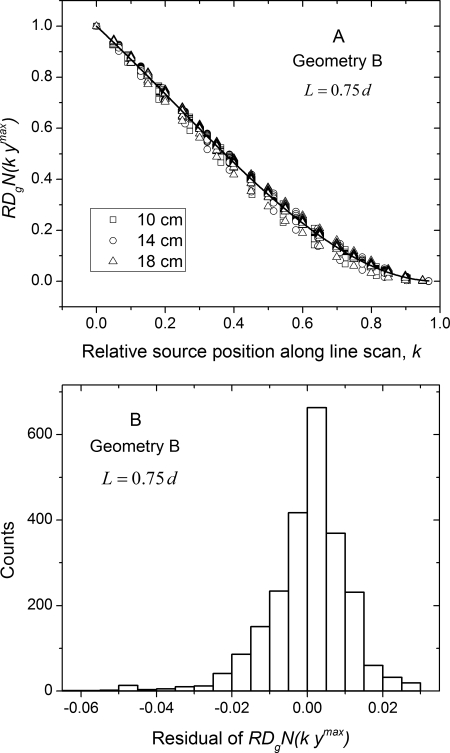
Figure 12.
(a) Monoenergetic relative glandular dose coefficient plotted as a function of relative source position along line scan for geometry B. The solid line is a third-order polynomial fit obtained by combining the data across all diameters, skin thicknesses, glandular fractions, and 10 x-ray photon energies. (b) Histogram of the residual from the polynomial fit.

