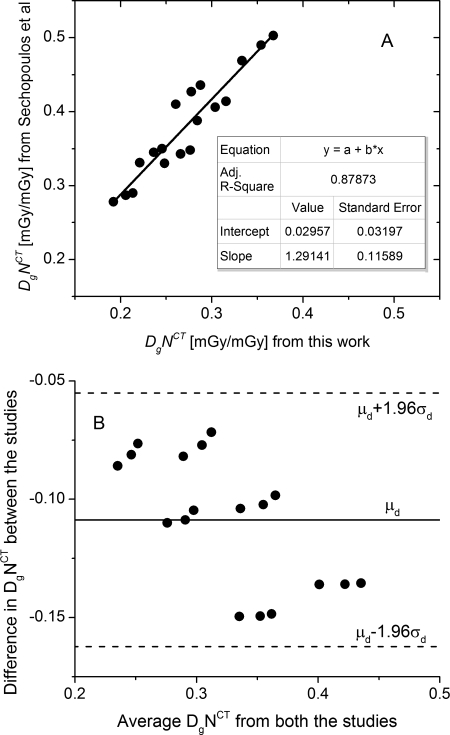
Figure 5.
Validation of our Monte Carlo simulation results with data published by Sechopoulos et al. (Ref. 16) A. Linear fit of from this work to published data shows reasonable correlation (adjusted ). B. Bland-Altman plot shows good agreement, where represents the mean difference between the studies and the standard deviation of the difference between the studies.

