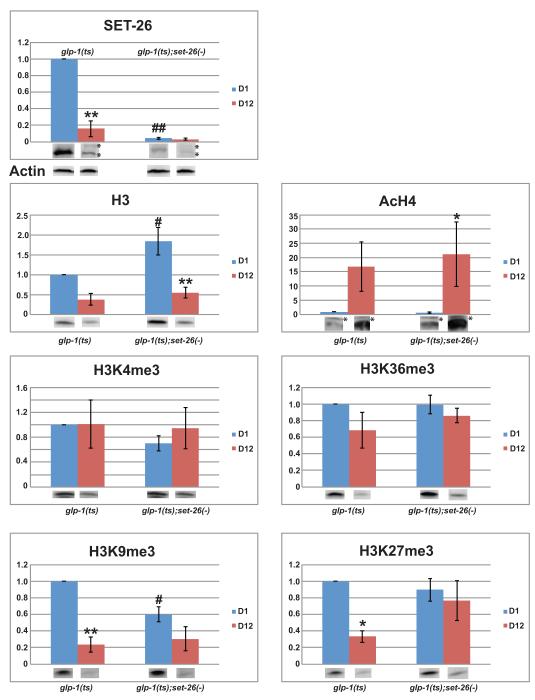
Figure 4. Deletion of somatic set-26 affects the levels of histone H3 protein and histone modifications in an age-dependent manner.
Synchronized glp-1(e2141) and glp-1(e2141ts);set-26(tm2467) worms were harvested at Day-1 (D1) and Day-12 (D12) adulthood at 25°C. Equal amount of worm total lysates were subjected to electrophoresis and western blot. A representative western blot is shown under each quantification chart, except that ACTIN blot is shown separately. Non-specific bands were labeled with “*”. SET-26 and histone H3 protein levels were normalized to Actin levels. AcH4, H3K4me3, H3K36me3, H3K9me3, and H3K27me3 were normalized to H3 levels (Supporting information). The amount of each epitope from the D1-glp-1(e2141) sample was set to 1. Error bars show standard error of mean (SEM) from 3-5 independent experiments. Two-way ANOVA was used to analyze the significance of the effect by genetic background (Mut), age (Age), and the interaction between Mutation and Age (Mut*Age). The set of p-values of (Mut, Age, Mut*Age) for each epitope is as following: SET-26 (<0.001, <0.001, <0.001), H3 (0.024, <0.001, 0.107), AcH4 (0.640, 0.001, 0.578), H3K4me3 (0.302, 0.462, 0.502), H3K36me3 (0.401, 0.042, 0.358), H3K9me3 (0.061, <0.001, 0.012), H3K27me3 (0.168, 0.005, 0.036). A p-value ≤0.05 is considered statistically significant. Tukey (HSD) pairwise comparison was also used. When comparing D1 and D12 samples of the same genetic background, we use “*” and “**” to denote p<0.05 and p <0.005, respectively. When comparing the two genetic mutants of the same age group, we use “#” and “##” to denote p <0.05 and p <0.005, respectively.

