Figure 1.
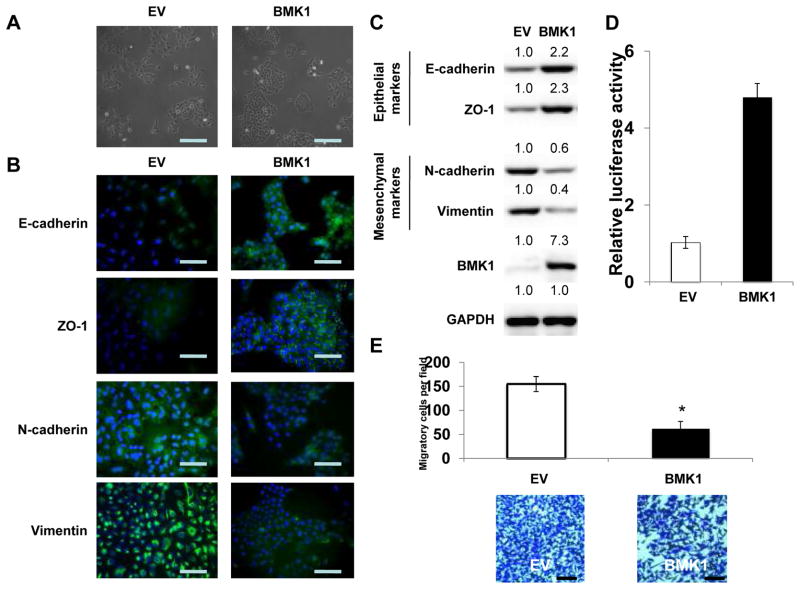
BMK1 enhances cell epithelial properties
(A) Phase-contrast microscopic images of A549 cells carrying control vector (EV) or expression vector encoding BMK1. Scale bar represents 50 μm. (B) Fluorescence microscopic staining of E-cadherin, ZO-1, N-cadherin and Vimentin (green) is indicated in the EV and BMK1 A549 cells. Nuclear DNA was stained with DAPI (blue). Scale bar represents 20 μm. (C) Expression levels of epithelial markers, E-cadherin and ZO-1, as well as mesenchymal markers, N-cadherin and Vimentin, were examined by immunoblotting of EV and BMK1 A549 cells. GAPDH was used as a loading control. The relative expression levels of indicated proteins in BMK1 cells was determined by setting the expression level, measuring by densitometry, in EV cells at a value of 1.0. (D) MEF2C transactivation activity was determined in EV and BMK1 A549 cells using luciferase assay. (E) Motility of EV and BMK1 A549 cells was analyzed. Each bar represents the mean ± standard deviation (s.d.) of samples measured in triplicate. *, P < 0.05. Scale bar represents 50 μm.

