
Figure 1. APOBEC3G inhibitors identified by high throughput screening.
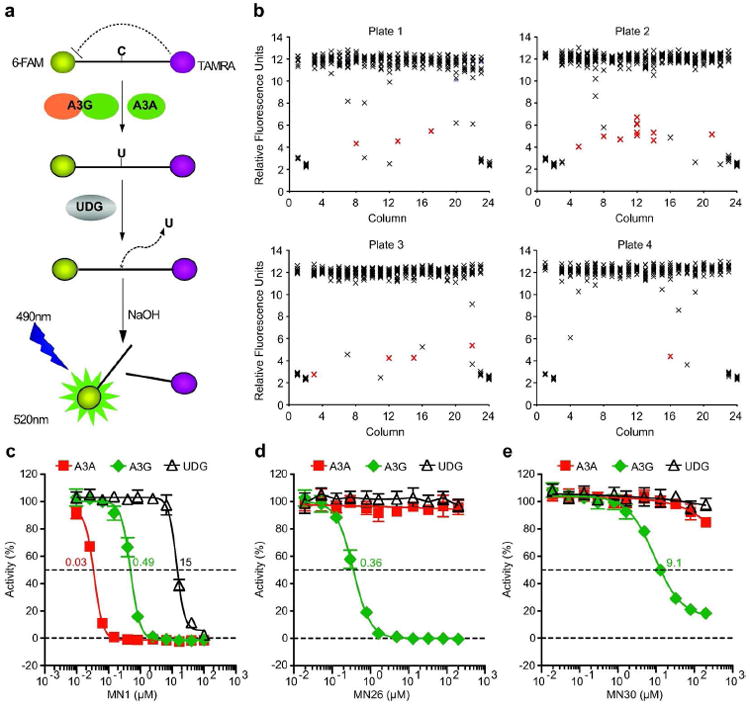
a) Schematic of the fluorescence-based ssDNA cytosine deamination assay. A3G or A3A deaminates C-to-U, UDG excises the U, NaOH breaks the phosphodiester backbone, and the 5’ fluorophore 6-FAM releases from the 3’ quench TAMRA. The resulting fluorescent read-out directly reports DNA deaminase activity because UDG and NaOH are not rate limiting.
b) Representative HTS data. Each X represents a single data point and the red-shaded X’s signify confirmed inhibitors. The first and last two columns of each LOPAC 384 well plate contain non-inhibitory (DMSO) or inhibitory (MN1) controls.
c, d, e) Representative A3G inhibitor dose response assays. The indicated concentrations of MN1, MN26, or MN30 were incubated with A3G (green symbols) or A3A (red symbols) in triplicate, and deaminase activity was quantified as above. UDG reactions lacked deaminase protein and used ssDNA substrate with a single uracil. Standard deviations and IC50 values are indicated.