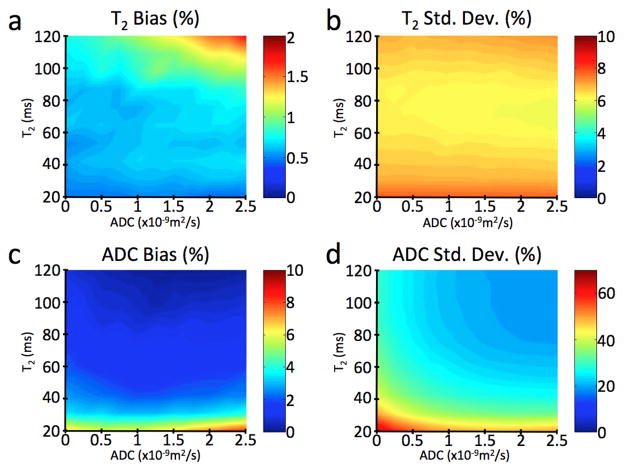
Figure 3. Simulation results verifying the accuracy of the T2 and ADC estimates.
We verified the accuracy of our estimates with Monte Carlo simulations for a range of different T2 and ADC values and with an SNR of 50 for the echo with the highest signal. The difference between the mean estimate for T2 and the true value is less than 2% in every simulated case, under 1% in most cases, and equal to 0.7% for the values expected for cartilage (T2 = 40 msec, ADC = 1.5×10⁻⁹ m2/sec) (a). The standard deviation of these T2 estimates (b) is always around 7%. The bias on the mean estimate for ADC is always less than 10% (c), and less than 5% for the values expected for cartilage. While the standard deviation of the ADC estimates can be as high as 75% for very low T2 and ADC values, it is 34% for the values expected for cartilage (d). Increasing the SNR of the modified 3D DESS images can substantially reduce this standard deviation: an SNR of 100 results in a standard deviation of 16%, and an SNR of 200 results in a standard deviation of 8%.

