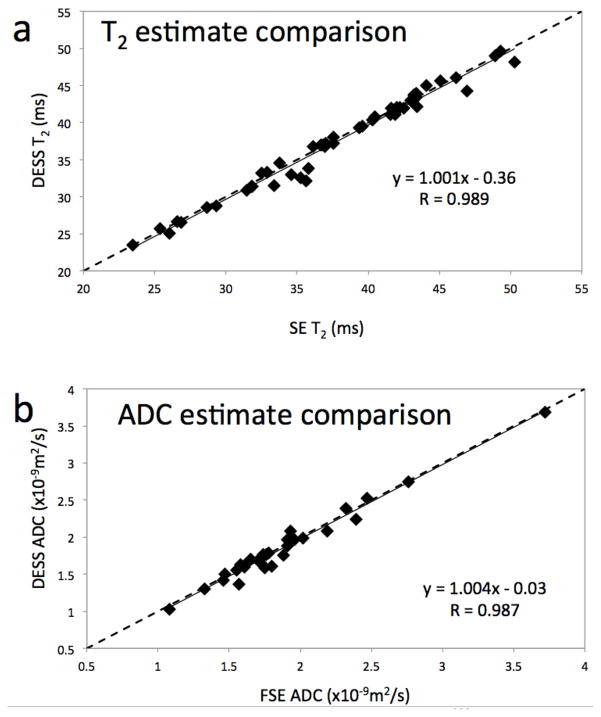
Figure 8. In vivo results.
In both plots, the location of each dot represents the mean values for each ROI using data from the modified 3D DESS acquisition (vertical) and standard SE techniques (horizontal). The T2 estimates from the modified 3D DESS sequence compare very well with those from the SE method (R = 0.989) (a). The slope of the linear correlation is only marginally larger than unity, and its zero-crossing absolute value is less than 0.5 msec. The high correlation and proximity of the fitted slope to unity indicate a very good match between the values obtained from both methods. Similar results are shown for the ADC values (b), with R = 0.987, the slope of the correlation less than 0.5% away from unity, and the zero crossing at −0.03 ×10⁻⁹ m2/sec.

