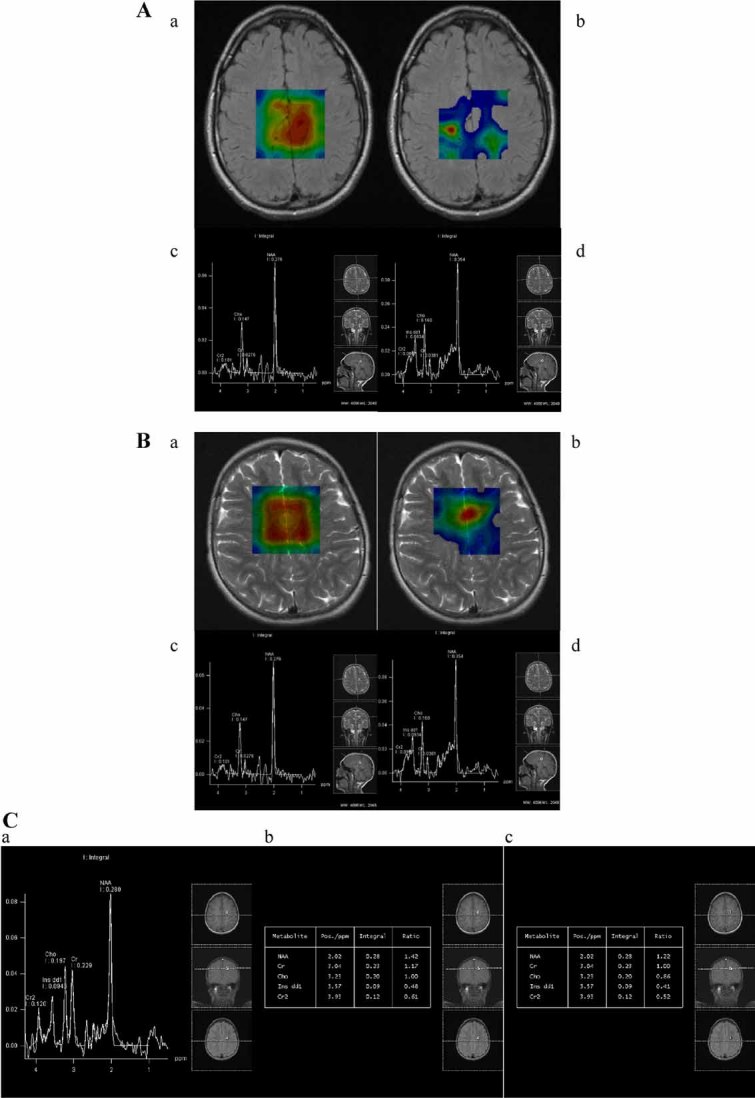
FIG. 4.

Panel (A) Patient 1's MRS spectra acquired with technique with SE sequences at TE 30 msec and TE 135 msec show severe reduction of the Cr peak. Red indicates a high concentration, while blue indicates a low concentration of metabolite. In (a) the concentration of NAA is reported. In (b) the Cr color map demonstrates only a small area with normal Creatine concentration. Tables of metabolite ratios (c,d). Panel (B) Axial FLAIR image of Patient 2 demonstrates normal appearing of white and gray matter in the centrum semiovale. An example of the two dimensional MRS sequence: data are presented as metabolic images of N-acetyl aspartate (NAA) (a) and creatine (Cr) (b). Red indicates a high concentration, while blue indicates a low concentration of metabolite. The Cr color map demonstrates a diffuse low concentration of creatine while the NAA color map shows a normal concentration of NAA. MRS technique with SE sequence at TE 30 msec demonstrates that the spectrum is severely abnormal with a Cr peak virtually absent. Tables of metabolite ratios (c,d). Panel (C) Normal MRS spectra of Patient 3 (a,b), comparable to a healthy 10 years old child (c).
