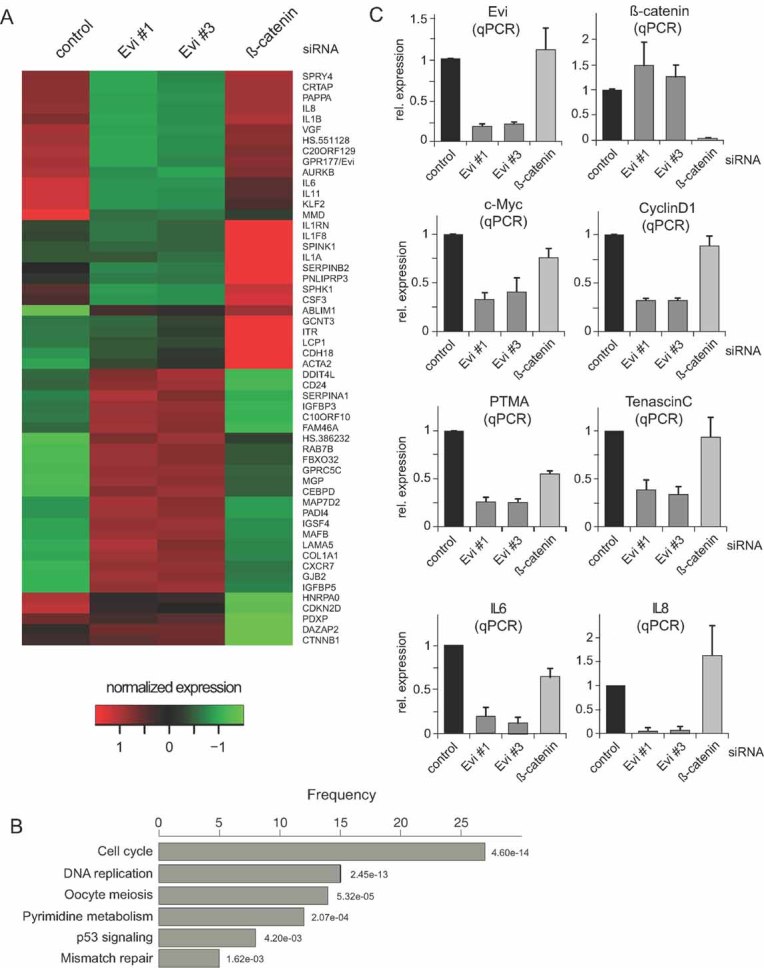
Heatmap based on normalized U87MG gene expression values of RNAi Evi#1, Evi#3, β-catenin and control samples. Rows represent genes, which are differentially expressed (p < 0.01) and have an absolute log2-fold change >1.5 compared to control, in Evi#1, Evi#3 or β-catenin silencing experiments.
Over-represented KEGG categories in set of differentially expressed genes (Fisher's exact test, p < 0.01). The length of the bars represents the number of genes within the set of differentially expressed genes that are annotated as part of the corresponding KEGG category. The numbers is red indicate the significance of the over-representation. The KEGG categories are not mutually exclusive. ‘Cell cycle’ is the most significant over-represented category.
Cells were transduced with indicated siRNAs. The relative mRNA expression levels of Evi, β-catenin, cyclin D1, c-Myc, PTMA, tenascin-C, and IL8 after Evi silencing analysed by quantified RT-PCR. Data are expressed as mean ± SD of three-independent experiments.